
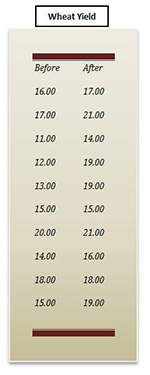
Good quantitative M&E reports must be rigorous in applying statistical tests, but should do so in a way that serves a better, reliable explanation of project performance to different stakeholders. Such evaluation should proceed with an argument, or a hypothesis, followed by analysis of evidence from the data to test it. Let me demonstrate by using a t-Test to evaluate the effects of an imaginary agricultural training program on the yield of wheat. The Wheat Yield figures for a sample of ten farmers before and after the program are represented in the box to the right.
A t-Test checks if two means (averages) are reliably different from each other. Can’t we just compare the absolute values of the means to know how they are different? Looking at the mean values before and after the program may tell the difference, but we can’t be sure if that is a reliable difference, i.e., whether it happened by chance or because of the intervention. The t value can be obtained through as a formula coded in statistical programs like SPSS. Basically, it is a ratio of the difference between the group(s) divided by the difference within the groups (Not too long ago evaluators had to calculate such statistic manually). The result indicates whether the trend in the overall data was haphazard or if it is statistically significant. If it is the latter, we infer that there must be a reason explaining the change aside from the result being a random chance. We then conclude that evidence shows the intervention (the training project) may have caused the change.
As shown below in the Mean Yield Before and Mean Yield After, the project was followed by an increase in the participants’ average production. I used these data to run a paired samples t-Test in SPSS. The pairing relates to the yield before and after the training. I am trying to determine whether the pattern of the data shows a reliably significant change in the average yield. The table below summarizes the key t-Test results as outputted by SPSS.
Paired Samples t-Test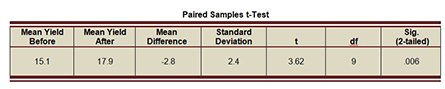
The average yield before training is 15.1. It increased to 17.9 after the intervention. The Mean Difference of 2.8 is negative because it is calculated by subtracting the smaller value from the larger one; but the important thing is that it is a substantial difference of 18.5%. The t value of 3.62 is substantial at 9 degrees of freedom (df=number of cases-1) and is statistically significant at the level of .006, which means that the pattern of the data indicates that there are 6 in 1000 chances that the increase in yield occurred by a random chance. This is a much more statistically significant than the conventional level of 5% (which corresponds to the widely acceptable margin of error). Based on this statistical evidence we can reject the null hypothesis that the training didn’t make a difference.
You can see how valuable this comparison of the means for appreciating the effect of the training program. In order to complete the analysis in our particular example one has to (ideally) demonstrate causation, which has three conditions:
- We need to demonstrate that the variables in question, training and crop yield, are related. This means that it must be demonstrated that change in the yield is associated with whether the farmers participated in the training or not. To test that we need to know who among the sampled farmers took part in the training then run a correlation test to find out whether there is a significant correlation (not the topic of this article).
- We also need to establish that the training took place before the observed changes in yield. This condition is assumed in our data.
- We also need to establish that there is no possible alternative explanation for the relationship between yield and training. The t-Test evidence helped us reject the null hypothesis that the change was just a random chance.
We have met the last two conditions. If the correlation test shows a significant association between the two variables, we can conclude that there is a causal relationship between training on new agricultural techniques and the yield of wheat.
About the Author
Dr. Mohamed Nimer has taught Quantitative Methods in Monitoring and Evaluation to working professionals. His interest in development and quantitative analysis has focused on issues of capacity building and institutional development. He has worked in various settings, including the Egyptian Delta and Middle Eastern and South Asian communities in North America. His doctoral work in political science concentrated on Development Administration. He published many quantitative studies and reports.
To learn more about American University’s online Graduate Certificate in Project Monitoring and Evaluation, request more information or call us toll free at 855-725-7614.