Skip to text alternative of the following infographic
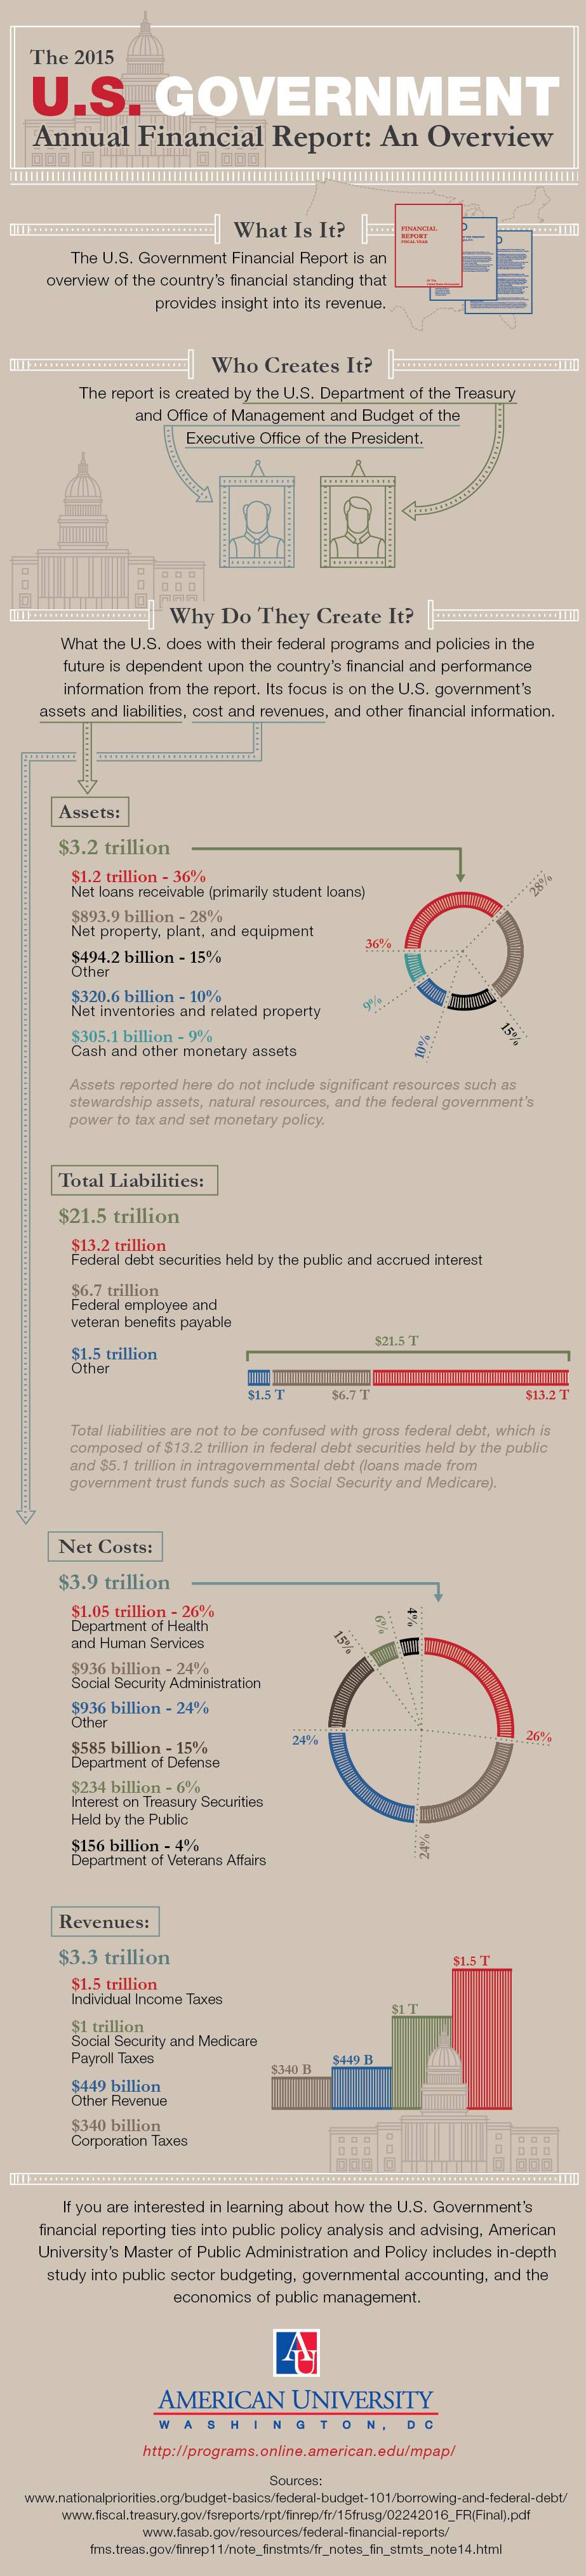
The 2015 U S Government Annual Financial Report: An Overview
What is it?
The U S Government Financial Report is an overview of the country’s financial standing that provides insight into its revenue
Who creates it?
The report is created by the U S Department of Treasury and Office of Management and Budget of the Executive Office of the President.
Why do they create it?
What the U S does with their federal programs and policies in the future is dependent upon the country’s financial and performance information from the report. Its focus is on the U S government’s assets and liabilities, cost and revenues, and other financial information.
Assets include 3.2 Trillion dollars broken into the following groups
1.2 Trillion dollars or 36 percent goes to net loans receivable (primarily student loans)
893.9 Billion dollars or 28 percent goes to net property, plant, and equipment
494.2 Billion dollars or 15 percent goes to other
320.6 Billion dollars or 10 percent goes to net inventories and related property
305.1 Billion dollars or 9 percent goes to cash and other monetary assets
Assets reported here do not include significant resources such as stewardship assets, natural resources, and the federal government’s power to tax and set monetary policy.
Total Liabilities include 21.5 Trillion dollars broken into the following groups
13.2 Trillion dollars goes to Federal debt securities held by the public and accrued interest
6.7 Trillion dollars goes to Federal employee and veteran benefits payable
1.5 Trillion goes to other
Total liabilities are not to be confused with gross federal debt, which is composed of 13.2 trillion dollars in federal debt securities held by the public and 5.1 trillion dollars in intragovernmental debt (loans made from governmental trust funds such as Social Security and Medicare).
Net Costs include 3.9 Trillion dollars broken into the following groups
1.05 Trillion dollars or 26 percent goes to Department of Health and Human Services
936 Billion dollars or 24 percent goes to Social Security Administration
936 Billion dollars or 24 percent goes to others
585 Billion dollars or 15 percent goes to the Department of Defense
234 Billion dollars or 6 percent goes to Interest on Treasury Securities Held by the Public
156 Billion dollars or 4 percent goes to the Department of Veterans Affairs
Revenues include 3.3 Trillion dollars broken into the following groups
1.5 Trillion dollars goes to Individual Income Taxes
1 Trillion dollars goes to Social Security and Medicare Payroll Taxes
449 Billion dollars goes to Other Revenue
340 Billion dollars goes to Corporation Taxes
If you are interested in learning about how the U S Government’s financial reporting ties into public policy analysis and advising, American University’s Master of Public Administration and Policy includes in-depth study into public sector budgeting, governmental accounting, and the economics of public management.
Get more information on the program at
http://programs.online.american.edu/mpap/
Sources include
www.nationalpriorities.org/budget-basics/federal-budget-101/borrowing-and-federal-debt/
www.fiscal.treasury.gov/fsreports/rpt/finrep/fr/15frusg/02242016_FR(Final).pdf
www.fasab.gov/resources/federal-financial-reports/
fms.treas.gov/finrep11/note_finstmts/fr_notes_fin_stmts_note14.html